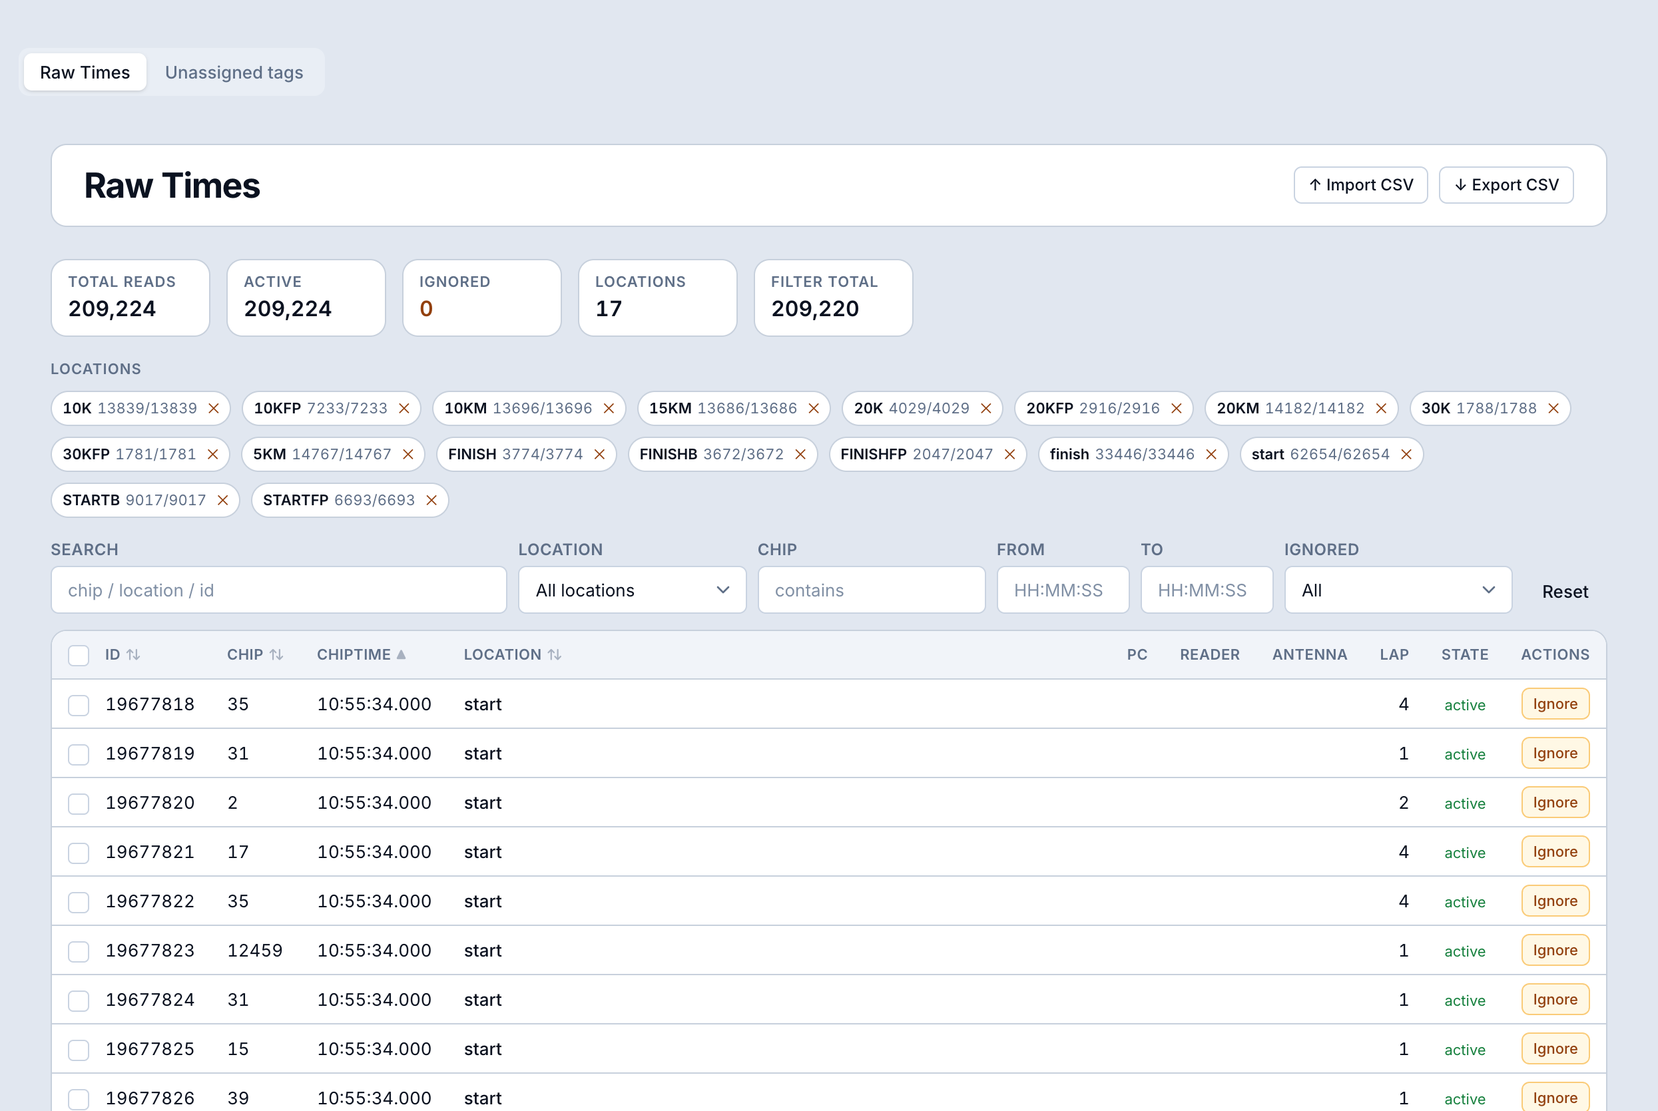
Every step of the scoring pipeline has a dedicated screen. The data is always there, always explainable - no black boxes, no spreadsheet rescue workflow required. From the first chip read at the start mat to the validated finish time, you can see exactly how each result was built.
When the gun goes off, you don't want to go hunting through menus. The dashboard puts every live signal on one page: a race clock per competition, the raw read stream as it arrives, the registered → started → finished funnel, top-10 leaderboards, calculation status and the health of every connected device. If something needs your attention, you see it here first.
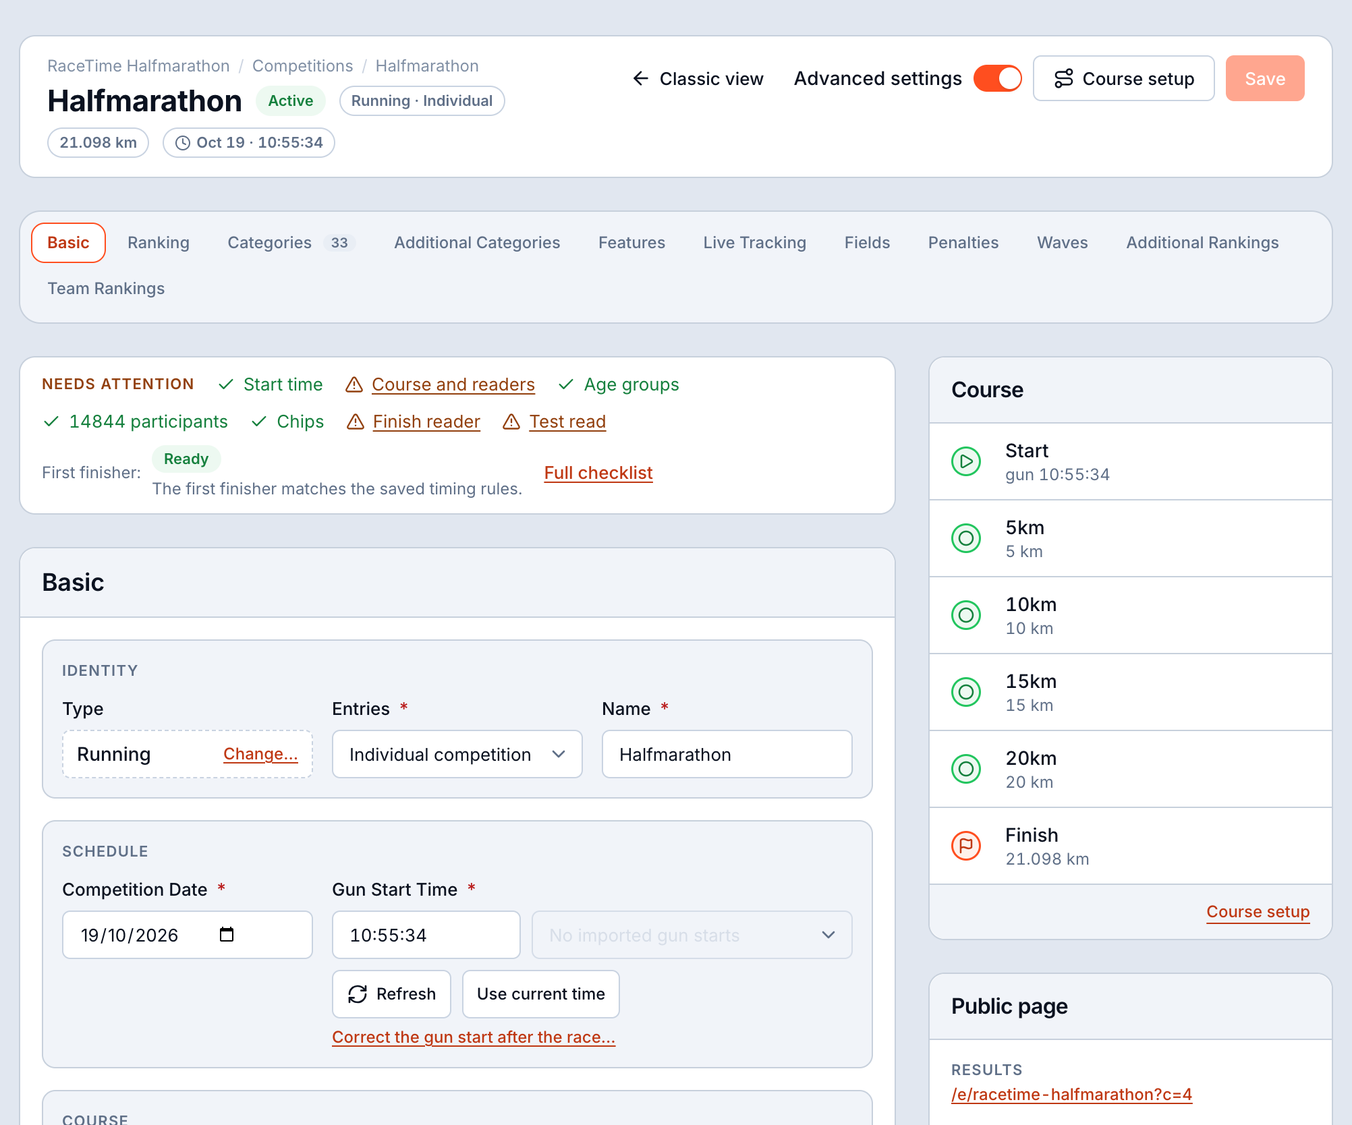
The course is the backbone of every result. You lay out timing points on a visual timeline, then tell each one how to behave - which readers feed it, in what priority, which points it depends on, and the rules that turn raw reads into clean splits. Multi-stage events like triathlon and duathlon are first-class, not a workaround.
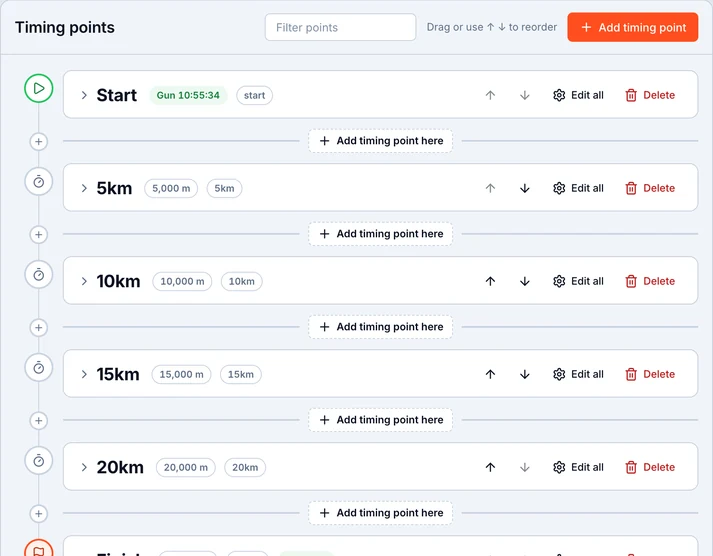
Drop start, splits, laps and finish onto a visual timeline. Drag to reorder, set distances, and see the whole course at a glance before a single read arrives.
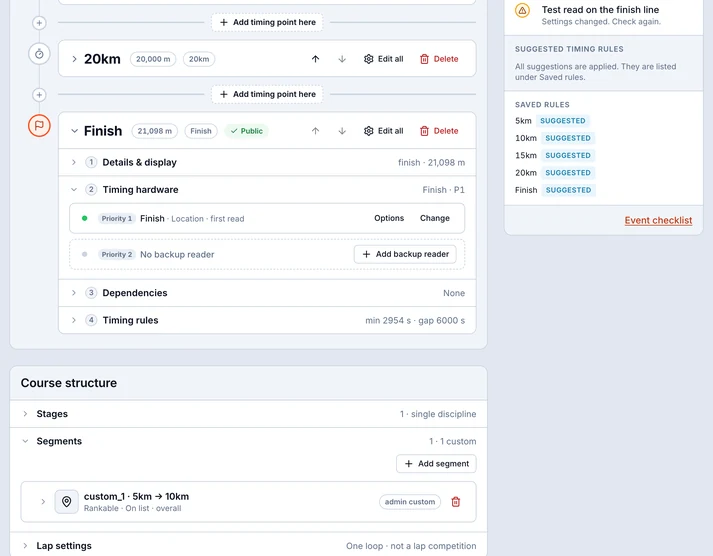
Assign the hardware that feeds a point, set reader priorities for when several see the same chip, add dependencies, and choose the timing rules that decide which read counts.
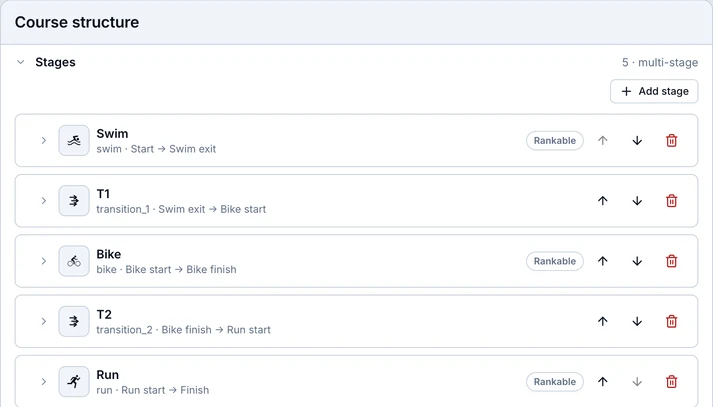
Triathlon, duathlon, swim-run - chain stages together with their own distances and transitions, and the engine scores each leg and the overall in one pass.
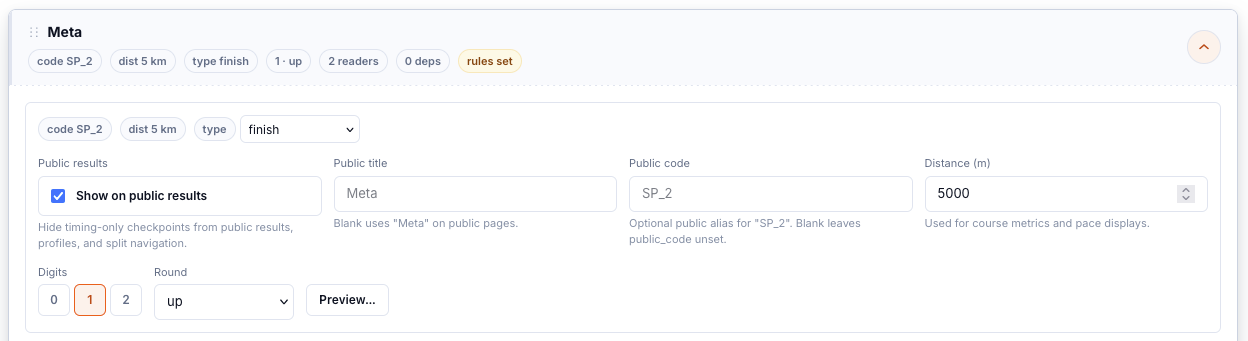
Open any timing point and set how it appears to the world - a public title and short code, its distance, and how times are rounded. The internal plumbing stays internal; participants only ever see the clean, named checkpoint.
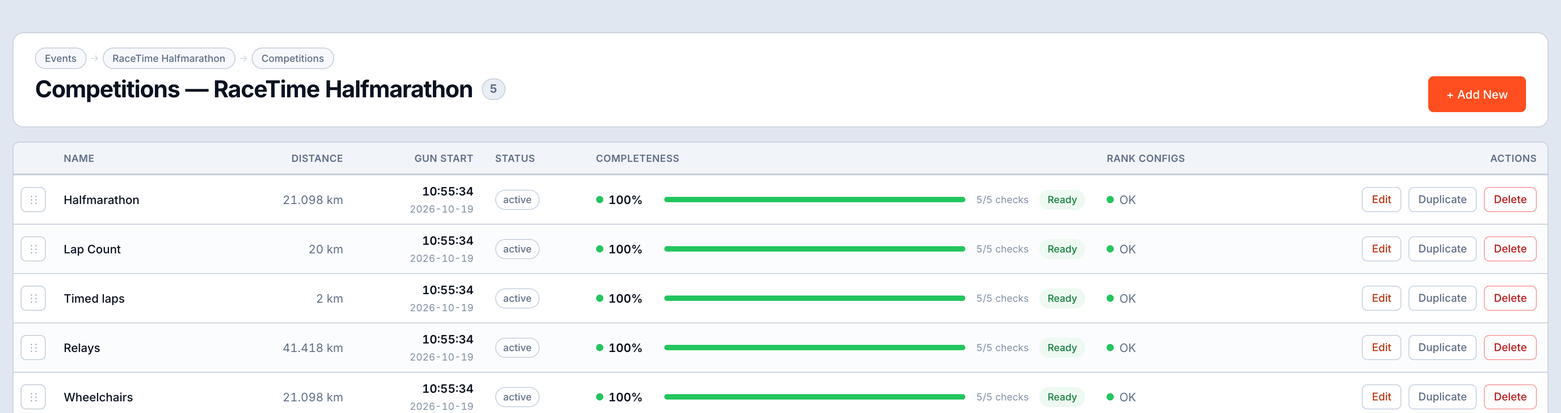
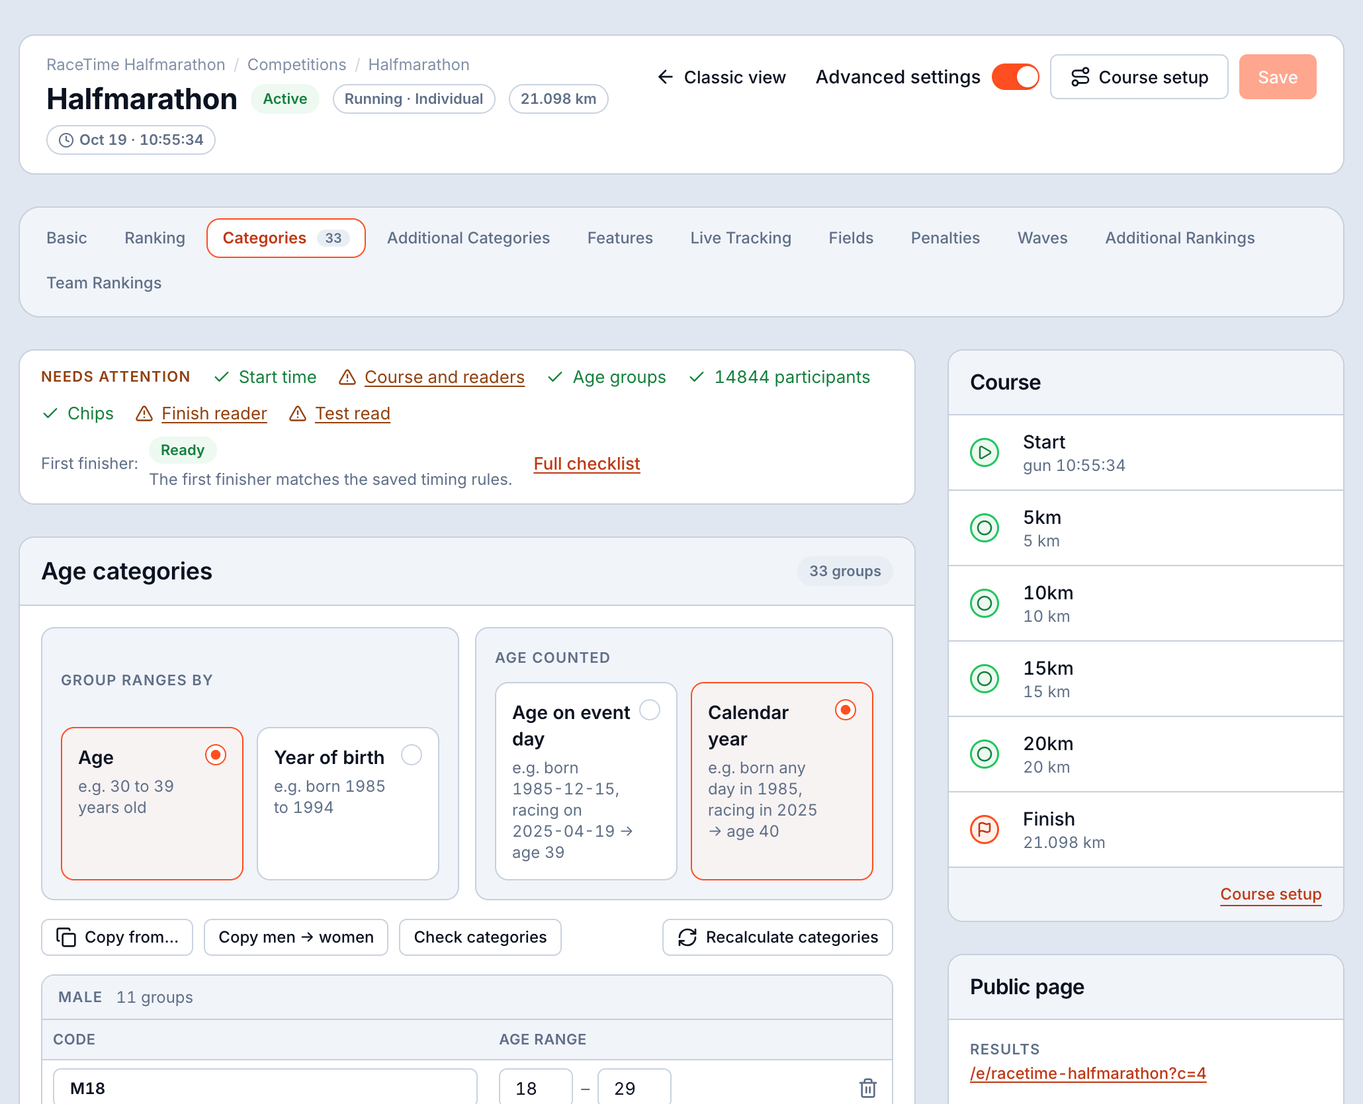
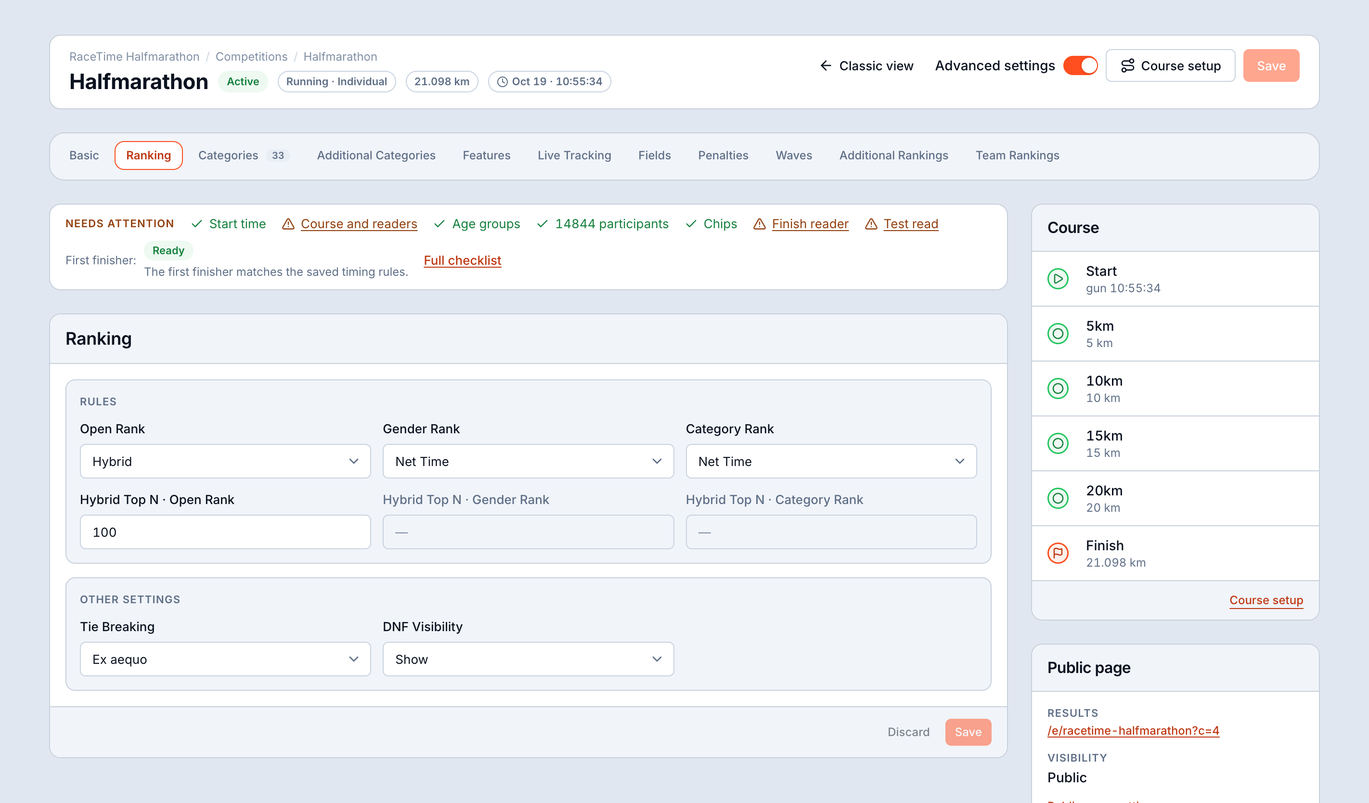
A single event might hold a marathon, a half, a 10K and a kids' run, each with its own rules. Every competition gets its own set of tabs - identity and timing, how it ranks, its categories, and the features it exposes to the public - so the engine scores it the way the race is actually run.
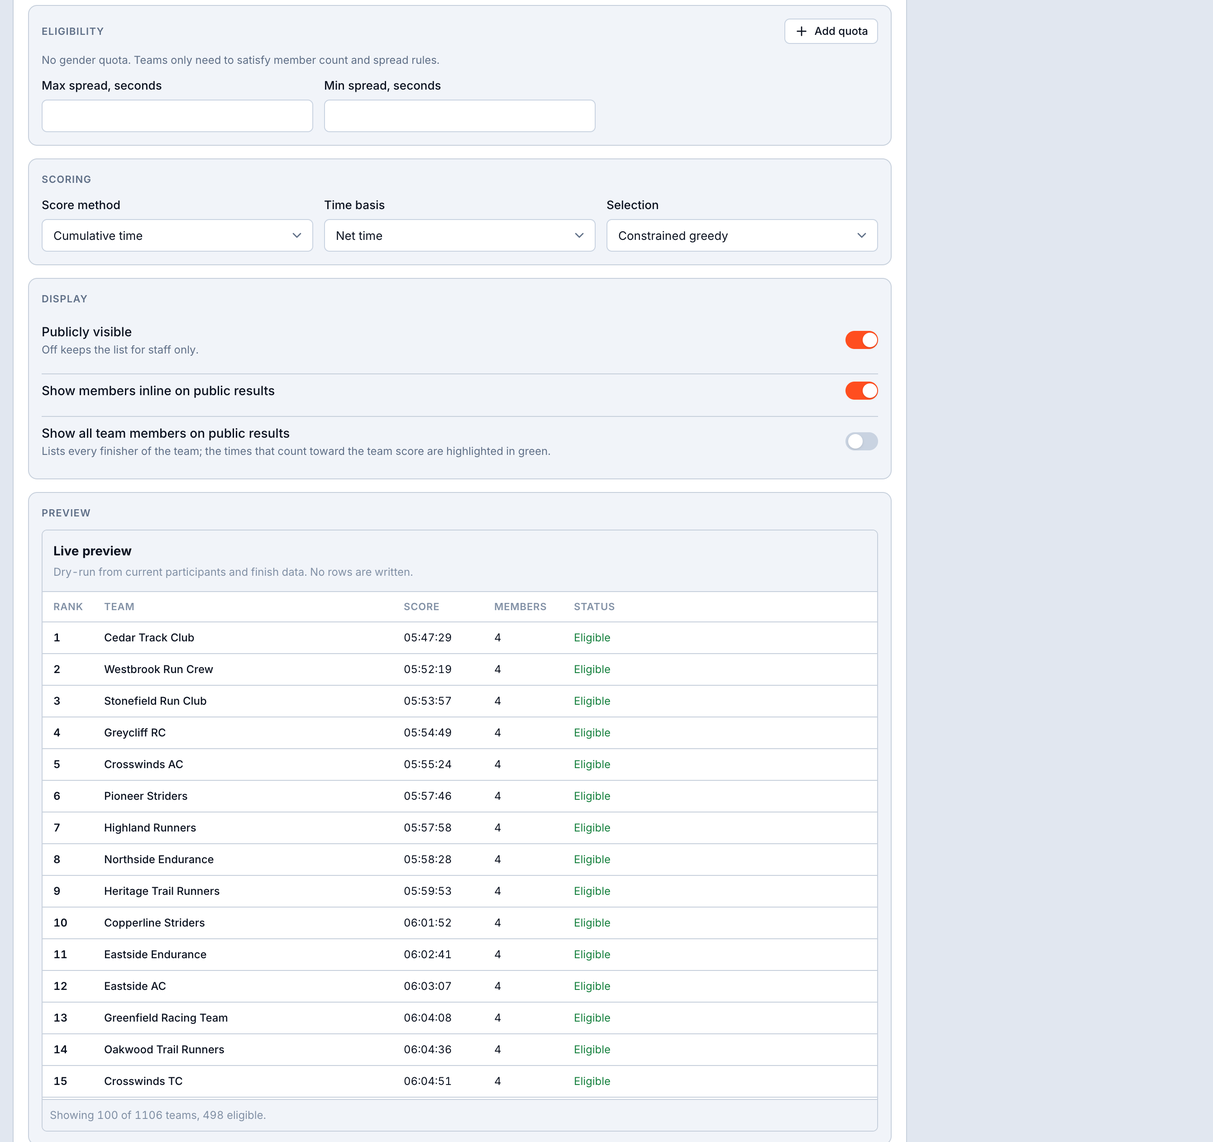
Some races live and die by the team result. Configure it the way your event runs it - best-N finishers, sum of times, or total rank - and the engine builds the team standings alongside the individual ones, no manual tallying.
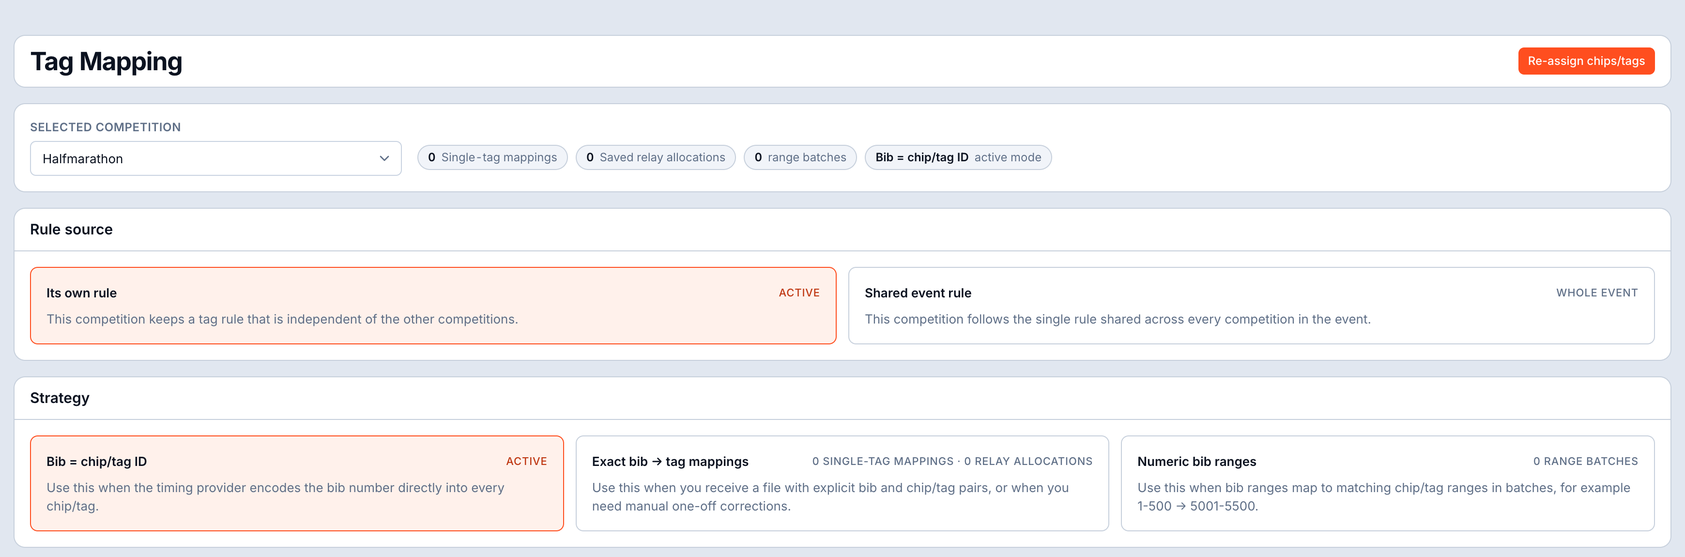
A read is just a chip code until you know whose bib it is. The mapping screen connects the two in whatever way your hardware hands them over - and it stays editable through the whole race, so a late swap or a re-chipped runner is a quick edit, not a crisis.
This is where the data becomes a result. Each screen does one job well, and together they let you go from a wall of raw reads to a clean finish time you can stand behind - and explain, line by line, to anyone who asks.
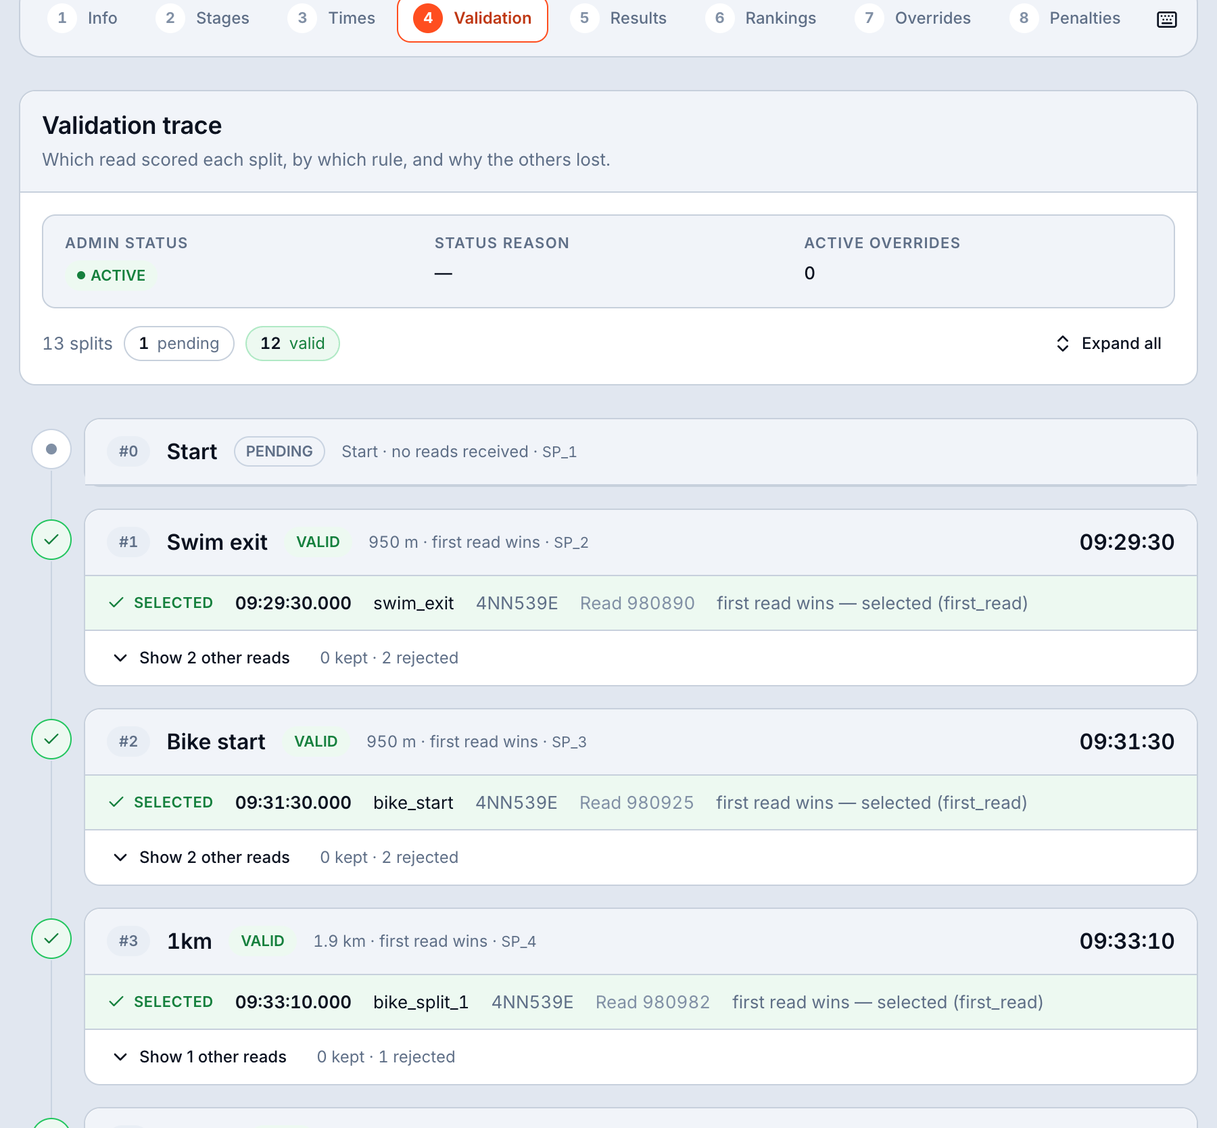
Open a participant and see every read they generated, grouped by checkpoint, with each one flagged as used or duplicate. Nothing is hidden and nothing is thrown away - you can always trace a time back to the exact reads behind it.
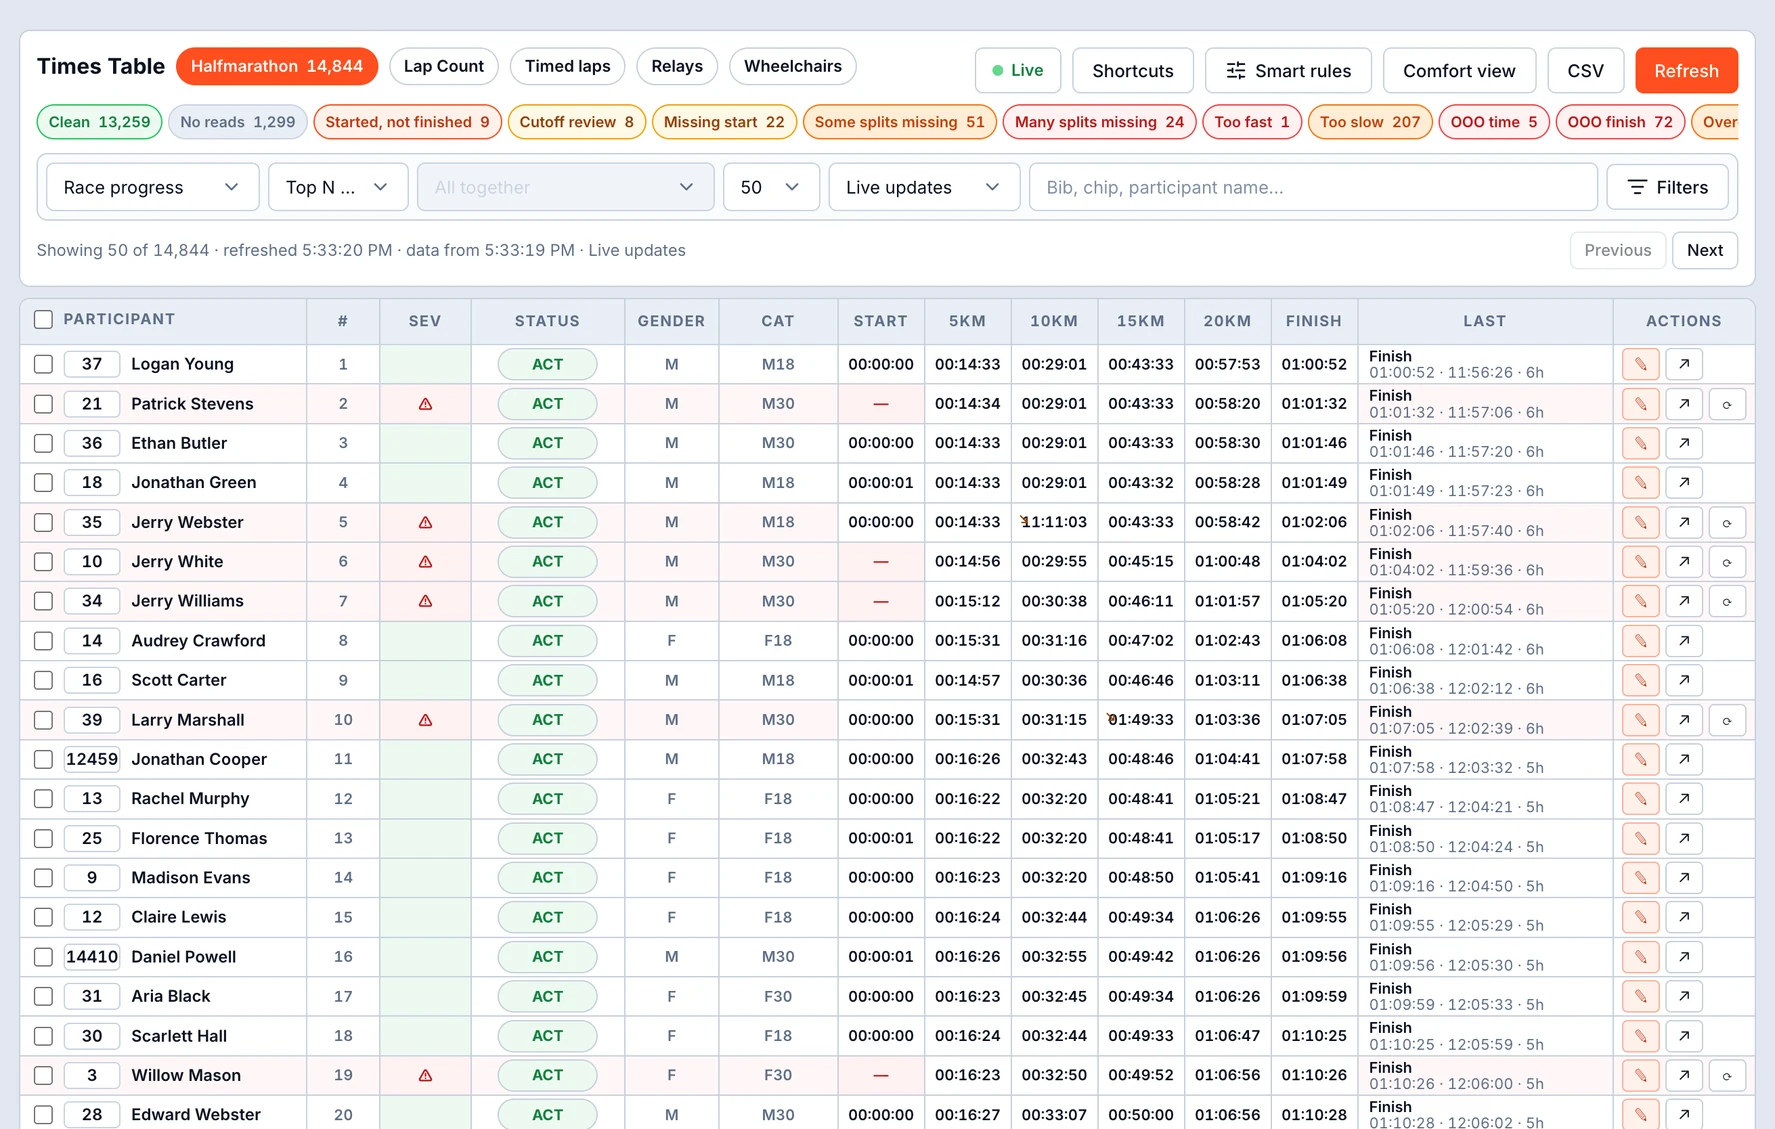
One row per participant, with smart-filter chips that bucket the entire field by issue type and show live counts as the race runs. A severity column tells you what to fix first, and you can edit times inline without leaving the table. It's the screen you'll keep open on race day.
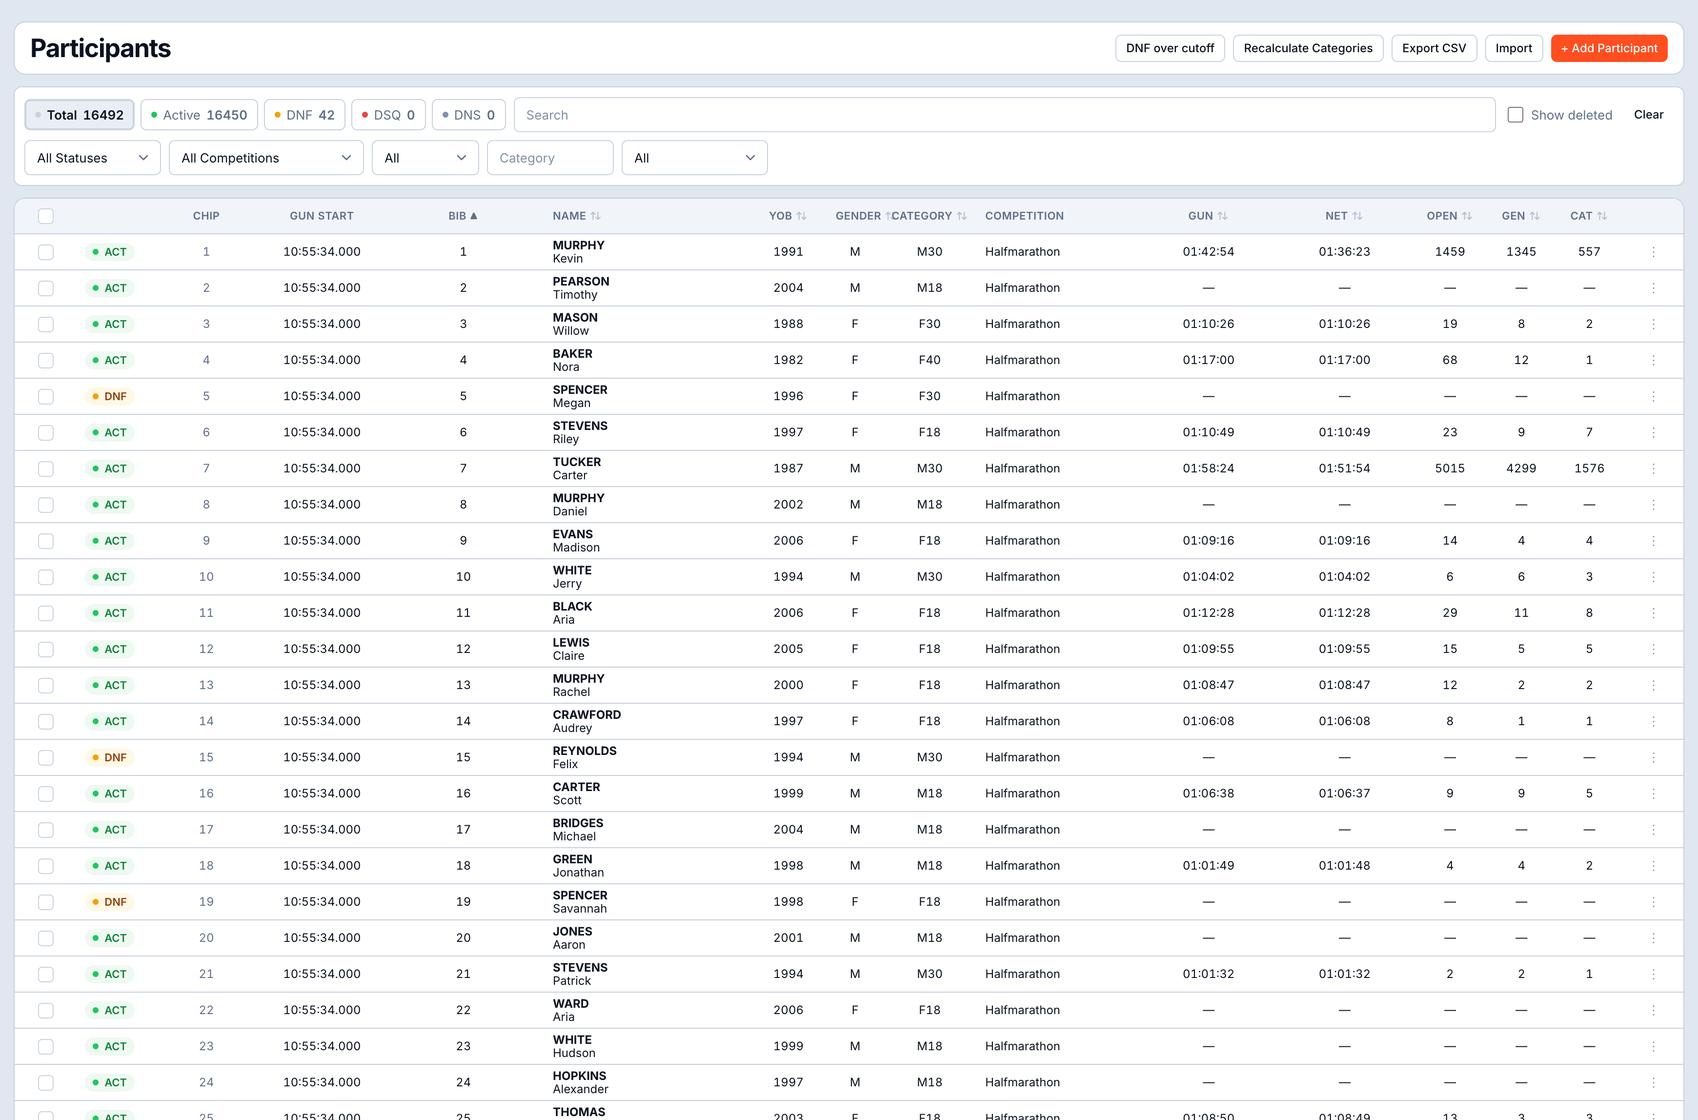
The full field at a glance, with Total, Active, DNF, DSQ and DNS counters across the top. Smart import gets everyone in fast, and you can add a late entry mid-race and it scores like any other runner from the moment they cross a mat.
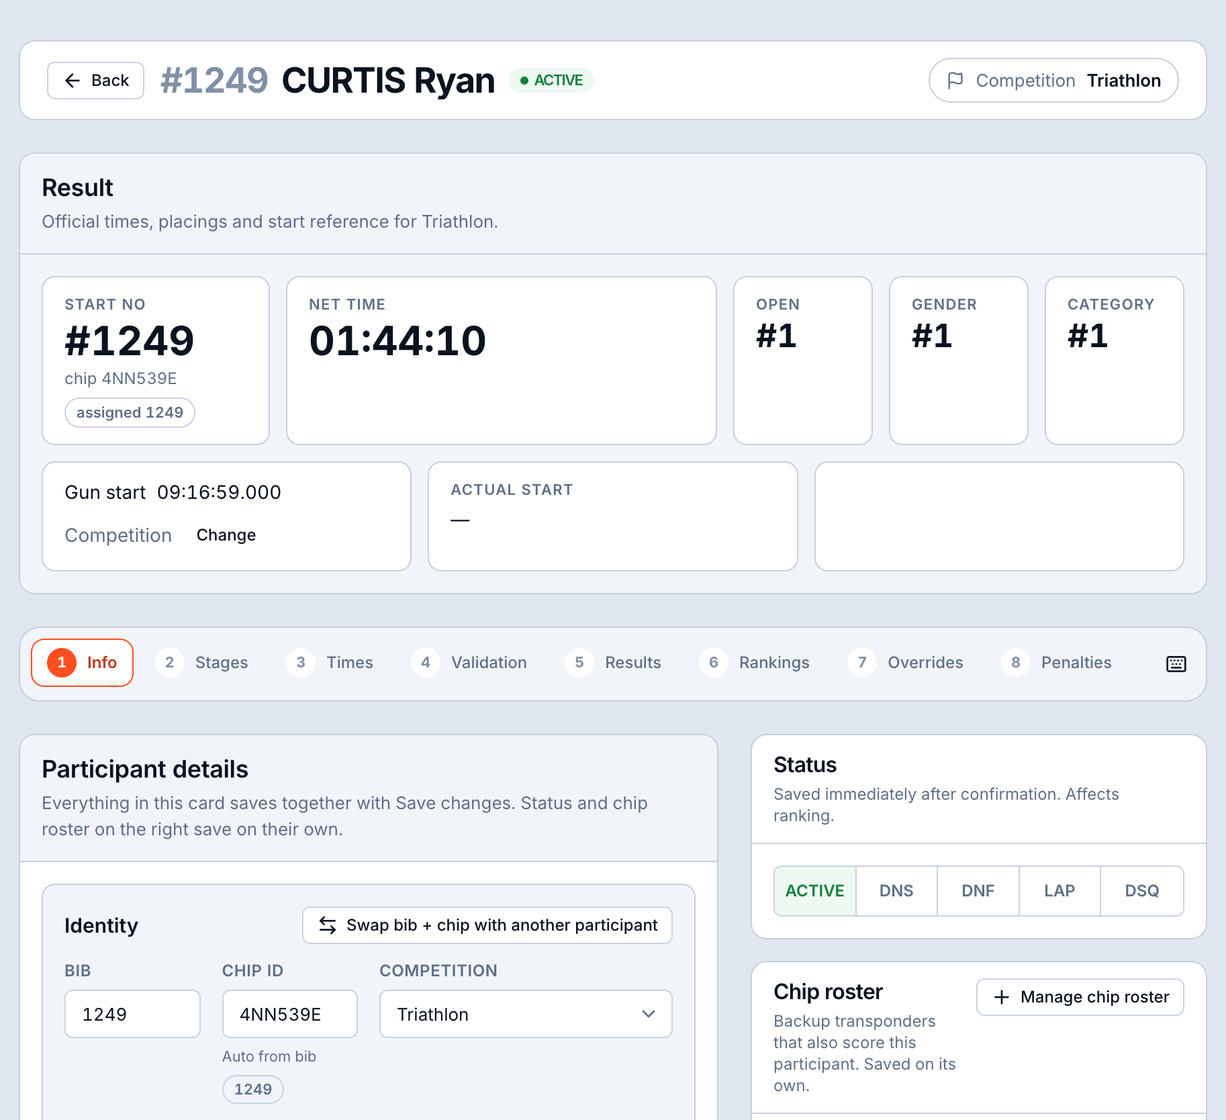
Drill into a single participant and you get two views that matter most: the data you can change, and the trace that proves the result is right.
A persistent top bar keeps the operations you trigger most often right where your hand already is. No digging through menus while the race is live - recalculate, jump to a screen, or fire a common action from anywhere in the event.
The pipeline you've just seen runs on infrastructure that's been proven where it counts - under load, at scale, with real athletes' results on the line.
The whole engine runs cloud-native on AWS, so it scales with your field and stays up when the start gun fires - no on-site server to babysit.
This isn't a prototype. The scoring pipeline has already run live events - including single races of more than 20,000 participants and 40+ events in one weekend - start to finish.
Every event's data is strongly isolated from every other. Your races, your athletes and your results stay yours - never mingled with anyone else's.